In this project, we will download historical S&P 500 index data from Yahoo Finance, performs some preliminary exploratory data analysis and manipulations, and then we will apply a Random Forest model to predict whether the index will go up or down on the next trading day based on the past data.
Let’s import the necessary modules and do some preliminary steps:
import yfinance as yf
import pandas as pd
import os

if os.path.exists("sp500.csv"):
    sp500 = pd.read_csv("sp500.csv", index_col=0,parse_dates=True)
else:
    sp500 = yf.Ticker("^GSPC")
    sp500 = sp500.history(period="max")
    sp500.to_csv("sp500.csv")

sp500.head()

Let’s go through the code:
os.path.exists("sp500.csv"): This line checks if the file « sp500.csv » exists in the current directory.os.path.exists()is a function from the built-in Pythonosmodule that returnsTrueif the specified path exists, andFalseotherwise.sp500 = pd.read_csv("sp500.csv", index_col=0): If the « sp500.csv » file exists, then this line reads the file into a pandas DataFrame using thepd.read_csv()function. Theindex_col=0argument means that the first (0th) column in the file is used as the index of the DataFrame.sp500 = yf.Ticker("^GSPC"): If the « sp500.csv » file does not exist, this line uses theyfinancemodule to create a Ticker object for the S&P 500.yfinanceis a popular Python library used to download historical market data from Yahoo Finance, which is what the « ^GSPC » ticker symbol represents.sp500 = sp500.history(period="max"): This line retrieves the historical market data for the S&P 500. Theperiod="max"argument means that the maximum amount of historical data available is retrieved.sp500.to_csv("sp500.csv"): This line saves the retrieved data to a CSV file named « sp500.csv » in the current directory. If the operation is successful and the program is run again, it will read the data from the CSV file instead of downloading it from the internet, which is faster and prevents unnecessary network usage.
So in essence, this code is designed to prevent unnecessary downloads. The first time you run it, it will download the data from the internet and save it to a file. Any subsequent times you run the code, it will just read the data from the file.
One can quickly convert the Data time to « year-month-day » format with:
# Convert the index to datetime and remove timezone
sp500.index = pd.to_datetime(sp500.index, utc=True).tz_convert(None)

# Remove the time portion from the datetime index
sp500.index = sp500.index.normalize()
Plot of the S&P 500 Close Prices:
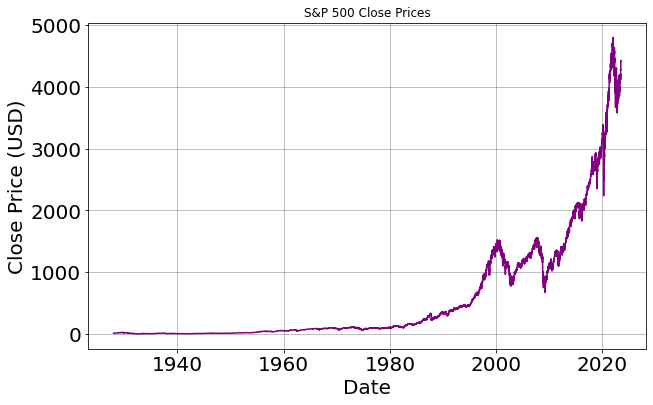
When visualizing the closing prices over time, one particular decade stands out as an intriguing era for investment, specifically the period from 2000 to 2010!
Random Forest prediction model
Predicting the stock market is a complex task due to its inherent volatility and uncertainty. There isn’t a single machine learning algorithm that is definitively the best for this task as the effectiveness of an algorithm can depend on many factors including the quality and type of data available, the specific prediction task, and how the model is trained and validated. However, several machine learning algorithms are commonly used in financial forecasting. Random Forests can capture complex, non-linear relationships between predictors and the target variable, which can be highly beneficial in financial data where relationships are seldom linear.
To Be continued..
0 commentaire